- Overall, the US labor market is tight as employers are holding onto workers despite the Federal Reserve’s ongoing rate hikes intended to push Americans back into the labor force
- Labor demand remains high as firms look to fill vacancies as layoffs & discharges decreased month over month (MoM) and year over year (YoY) by 10.9% and 5.5% respectively
- Job openings were up in accommodation and food services (+215K), health care and social assistance (+115K), and transportation, warehousing, and utilities (+111K), while the largest decreases were in wholesale trade (-104K) and in finance and insurance (-83K)
- There were 4.9 million more job openings than workers available, an increase from the previous month of 4.2 million
- Total nonfarm payroll increased by 261,000 over September to October, reaching 153.3 million resulting in an increase of 0.2% MoM and 3.6% YoY
- The headline unemployment rate (U-3) increased from 3.5% to 3.7% over September to October
- Comparing the numbers to pre-pandemic levels, the share of unemployed Americans who took less than five weeks to find a job increased by 2.5% between February 2020 and October 2022, while the share of those unemployed between 15-26 weeks remained unchanged
- The labor force participation rate decreased slightly from 62.3% to 62.2% over September to October remaining 1.2 percentage points below pre-pandemic levels
- Wages remain below inflation as annual nominal wage growth is 4.7% compared to annual inflation which is at 7.7%
Job market remains tight
Job openings increased from 10.2 to 10.7 million over August to September, an increase of 4.3% MoM and 0.4% YoY indicative of a tight labor market. There were 4.9 million more job openings than workers available, a slight increase from the previous month of 4.2 million. Job openings were up in accommodation and food services (+215K), healthcare and social assistance (+115K), and transportation, warehousing, and utilities (+111K), while the largest decreases were in wholesale trade (-104K), and in finance and insurance (-83K).

The ratio of job openings to job seekers which serves as a measure of labor market tightness increased by 9.0% MoM; however, it increased by 33.8% YoY. The ratio remains at an elevated level and has increased by 52% since the pre-pandemic days. The US labor market remains tight as it is still a job seekers market, and the recent data will result in future interest rate hikes by the Federal Reserve which is trying to achieve full employment while reaching a 2% inflation target per its mandate.

Total nonfarm payroll increased by 261,000 over September to October, reaching 153.3 million resulting in an increase of 0.2% MoM and 3.6% YoY, further evidence of high demand for labor and a tight US labor market. Employment gains were up in health care (+53K), professional and technical services (+43K), and manufacturing (+32K).

Unemployment & Labor Force
The headline unemployment rate (U-3) increased from 3.5% to 3.7% over September to October, while the labor force participation rate slightly decreased from 62.3% to 62.2% over the same period, remaining 1.2 percentage points below pre-pandemic levels. Alternative measures of labor utilization such as the (U-6) unemployment rate, which captures the marginally attached (discouraged workers) and those that work part time for economic reasons, increased from September to October from 6.7% to 6.8%. The employment-to-population ratio, which is the proportion of the country’s working age population that is employed, declined from September to October from 60.1 to 60.0 and remains 1.2 percentage points below pre-pandemic levels. It is more apparent by gender that given the caregiving responsibilities women have undertaken in the past two years, there is still a trend to see a lower employment to population ratio for women compared to men.

US labor markets continue to experience slack or inefficiencies in the economy; however, there are now 84,000 more civilians in the labor force, and the labor force participation rate is 1.2% below pre-pandemic levels.

The share of unemployed Americans who took less than five weeks to find a job decreased by 0.8% MoM; however, it increased by 31.6% YoY. In comparison, the share of Americans unemployed 27 weeks and over experienced a 39.4% decline YoY in comparison to those unemployed between 15-26 weeks who experienced a 2.2% decline YoY. Comparing the numbers to pre-pandemic levels, the share of unemployed Americans who took less than 5 weeks to find a job increased by 2.5% between February 2020 and October 2022, while the share of those unemployed between 15-26 weeks remained unchanged. There is also a strong, positive correlation between layoffs and discharges to those employed less than five weeks, suggesting that Americans are still able to find work given involuntary terminations.

Reasons for Not Working
The US Census Bureau’s most recent release of the Household Pulse Survey Data covering the time from October 5, 2022 to October 17, 2022 surveyed Americans on several issues, including employment and reasons why they were not working. Of the almost 100 million Americans surveyed, the top three reasons for not working outside of retirement (46 million), other reasons (17.8 million), and did not report a reason (5.4 million) include being sick or disabled (11.9 million), individuals not wanting to be employed at the time of the survey (6.7 million), and caregiving for children not in school or daycare (4.4 million). There was a 23.4% increase in individuals not wanting to be employed between Household Pulse Survey Week 39 (Sep 29, 2021-Oct 11, 2021) and Week 50 (Oct 5, 2022-Oct 17, 2022), followed by a 70.1 percent increase in being sick or disabled. The reason of caring for self or someone with coronavirus symptoms experienced a decrease of 57.3% between both surveys, however it is still of concern for many Americans not in the labor force. Employers will need to address high priority issues that concern caregivers and other challenges related to short- and long-term sicknesses related to COVID and non-COVID.

Separations decrease, including quits and layoffs
Total separations – the summation of quits, layoffs/discharges and other separations decreased by 6.1% from August to September; and decreased by 5.3% over the last three months. Quits decreased by 2.9% MoM; and decreased by 4.5% YoY. Quits were up in state and local government, excluding education (+15K) and down in construction (-56K). Employers are holding onto workers as layoffs/discharges decreased MoM and YoY by 10.9% and 5.5% respectively. The last three months show that layoffs/discharges have decreased by 5.1% and quits have decreased by 4.5%.

Initial jobless claims which serve as a proxy for layoffs remain low, signaling that employers are holding onto scarce labor.

Tech Layoffs
Despite the headline news of tech layoffs, there is still data which indicates that there is demand for tech services and applications in business. The share of layoffs among startups by industry YTD are the highest in other industries, food, and transportation according to Layoffs.fyi. However, recent data collected from the biweekly US Census Bureau’s Business Trends & Outlook Survey conducted October 10, 2022, to October 23, 2022, found that businesses in accommodation and food services reported the highest increase among industries for their demand of online platforms to offer goods and services.

Quit rates by industry have declined for all industries YoY and MoM except for accommodation and food services which experienced a 3.3% increase YoY, while professional and business services experienced a 6.7% increase MoM. Overall, a decline in quit rates indicates that workers are cautious about the economic uncertainty of finding new employment. The most recent Survey of Consumer Expectations from the Federal Reserve Bank of New York reports that Americans’ job separation expectations of losing their job increased over August to September from 11.1% to 11.6%.

Radancy collects data on candidate experience from survey data that comes from over 1M candidate experience surveys completed across our network of enterprise career sites. Recent data indicates that work with a greater purpose, interesting & challenging work, and getting ahead in careers have increased YoY for both males and females, while compensation and benefits, convenience, and good people to work with have declined for both genders YoY. In the last three months, females experienced a 26.5% increase in prioritizing convenience while males experienced a 17.3% increase.

Gains in Employment and Average Hourly Earnings
Leisure & Hospitality experienced the largest gain in average hourly earnings since pre-pandemic days and YoY, however employment levels increased YoY, but have declined since pre-pandemic. Overall, wages remain below inflation as annual nominal wage growth is 4.7% compared to annual inflation, which is at 7.7%.

Higher Education
New data from the National Student Clearing House reports that undergraduate enrollment declined by 1.1% between the fall of 2021 and 2022, while the National Center for Education Statistics indicates that average tuition and fees of degree-granting institutions for first-time undergraduate students continues to climb for all institutional categories when comparing the enrollment periods of 2020-2021 to 2010-2011. Strada Education Network surveyed 3,000 alumni in 2021 and 2022 regarding their views on higher education’s value in the workforce. In 2022, 65% of alumni reported that education was worth the cost in comparison to 76% in 2021. As the cost of higher education rises, skill-based hiring is one of the many strategies firms are leveraging to fill vacancies that prioritize skills and experience over formal education requirements. The share of those who found their education not worth the cost was higher in 2022 (23%) in comparison to those who were surveyed in 2021(14%).

US Economic Outlook
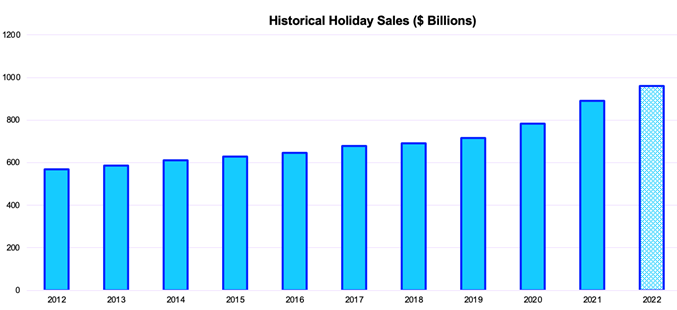
As the holiday season nears, the National Retail Federation has forecasted that Americans will spend from $942.6 billion to $960.4 billion this holiday season for the months of November and December as consumer spending remains robust despite high prices. Consumption makes up 66% of the US GDP, with the most recent data indicating that consumption contributed 0.97% to the change in overall real GDP between Q2 and Q3 of this past year. Recent inflation data from the Bureau of Labor Statistics (BLS) reported that the consumer price index (CPI) increased by 0.4% MoM and 7.7% YoY, while the Core CPI, which excludes food and energy, increased by 0.2% MoM and 6.3% YoY.
Economic projections from the Federal Reserve Banks of New York and Cleveland forecast a 23.1% and 25.1% probability of a US recession respectively in August 2023 based on treasury spreads. Labor force participation rates continue to remain below pre-pandemic levels due to factors such as long-term COVID symptoms, caregiving responsibilities, lack of worker interest in joining the labor force, and worker preferences for flexibility and remoteness. There is a paradigm shift in today’s labor market that business leaders in talent acquisition will have to adjust to source and retain talent.

- 4 Ways to Equip Your Recruiting Team for Success in Today’s Job Market - August 8, 2024
- Market Your Benefits to Employees with Virtual Benefits Fairs - February 15, 2024
- 12 Best Virtual Career Fair Technology & What to Look For - February 15, 2024
- Building a Better Campus Recruiting Playbook - January 23, 2024
- The Anatomy of a Hiring Event Strategy - January 15, 2024
- Beyond Career Fairs: 5 More Ways to Use Your Hiring Event Technology - January 2, 2024
- Your Recruiting Playbook: The Template for a Hiring Event Strategy - December 7, 2023
- How to Measure Candidate Experience Earlier—and Why It Matters - November 5, 2023
- The Scoop: Recruitment Trends & Industry Insights | October 2023 - October 31, 2023
- Top Strategies for Hiring Veterans & Military Spouses - October 3, 2023


You must be logged in to post a comment.